
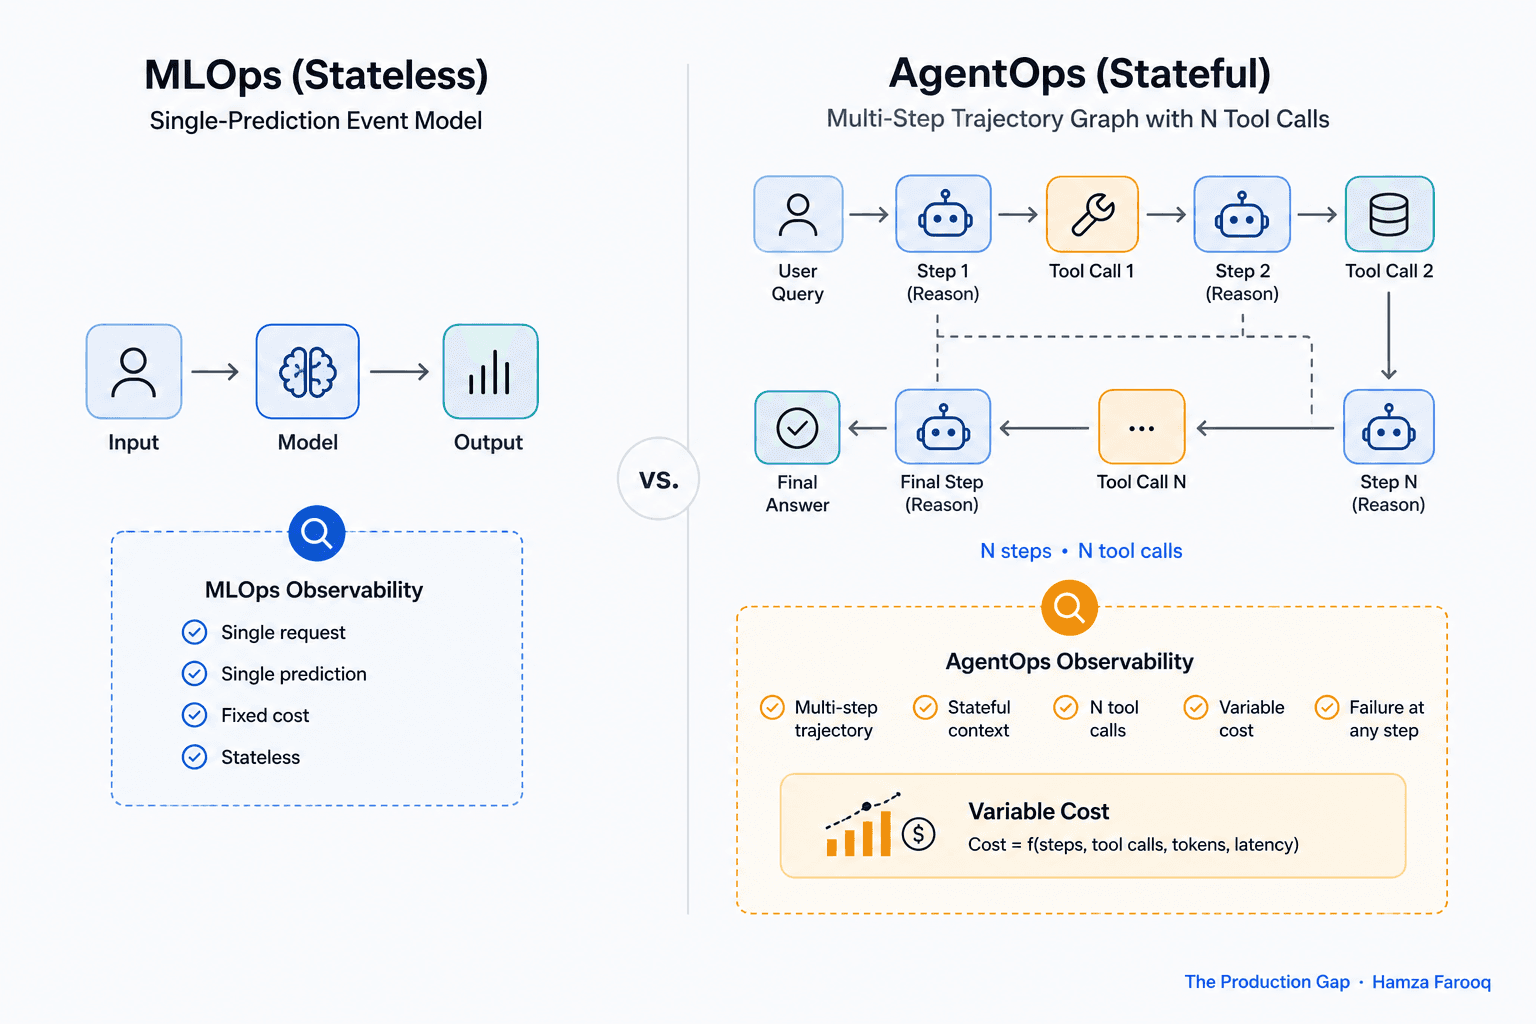
TL;DR: MLOps observability breaks for tool-calling agents because it is stateless and event-scoped, while agents are stateful and trajectory-scoped. Traditional metrics like latency and accuracy cannot surface which tool call broke a trajectory, which step inflated cost, or why an agent looped. Purpose-built agent observability tools solve this with trace-level tool-call logs, full trajectory replay, and cost attribution per task, capabilities that general MLOps platforms do not provide natively.
Key Takeaways
- MLOps metrics miss agent reality: latency and drift tracking tells you nothing about why an agent made a wrong decision three tool calls ago.
- Trajectory traces replace raw logs: a trajectory trace reconstructs the full decision-and-tool-call sequence so engineers can pinpoint failures instead of guessing.
- Tool-call visibility is essential: which tools were invoked, in what order, and with what inputs is the minimum data needed to debug a failed multi-step task.
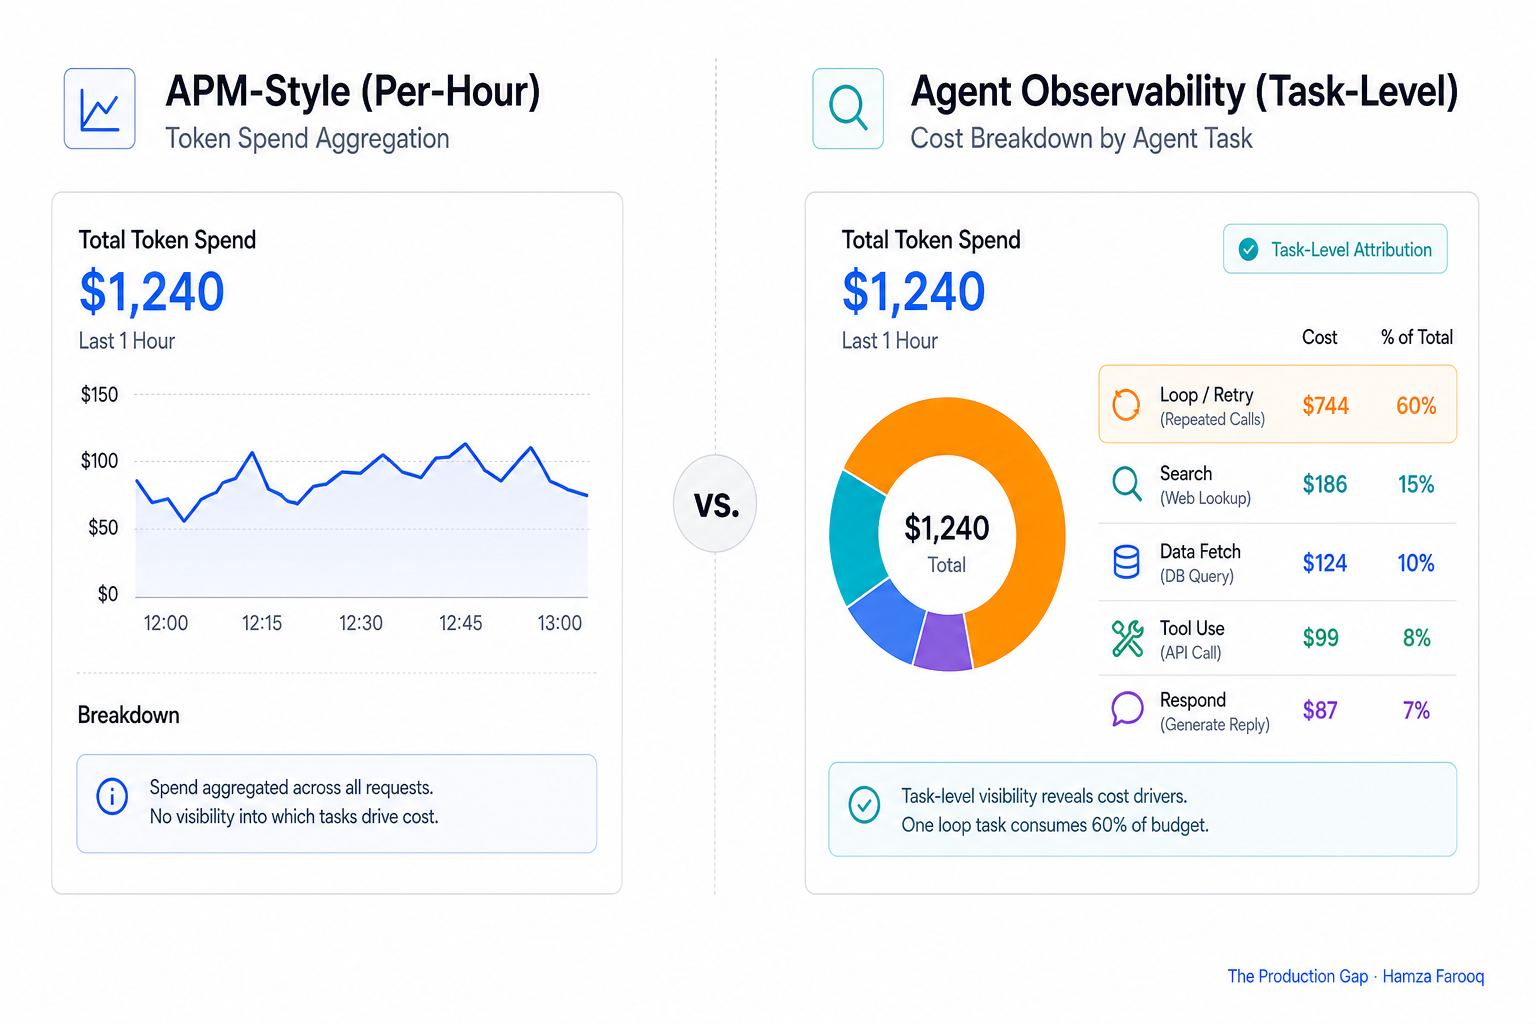
- Cost attribution requires task-level accounting: token costs tracked per request rather than per task make agent spending difficult to audit.
- Purpose-built tools vs. adapted ones: extending general platforms requires real engineering investment that teams should weigh against tools designed for agentic workflows from the start.
- The debugging gap has billing consequences: undetected failure loops can affect downstream outputs before standard dashboards surface any anomaly.
Why does MLOps observability fail for tool-calling agents?
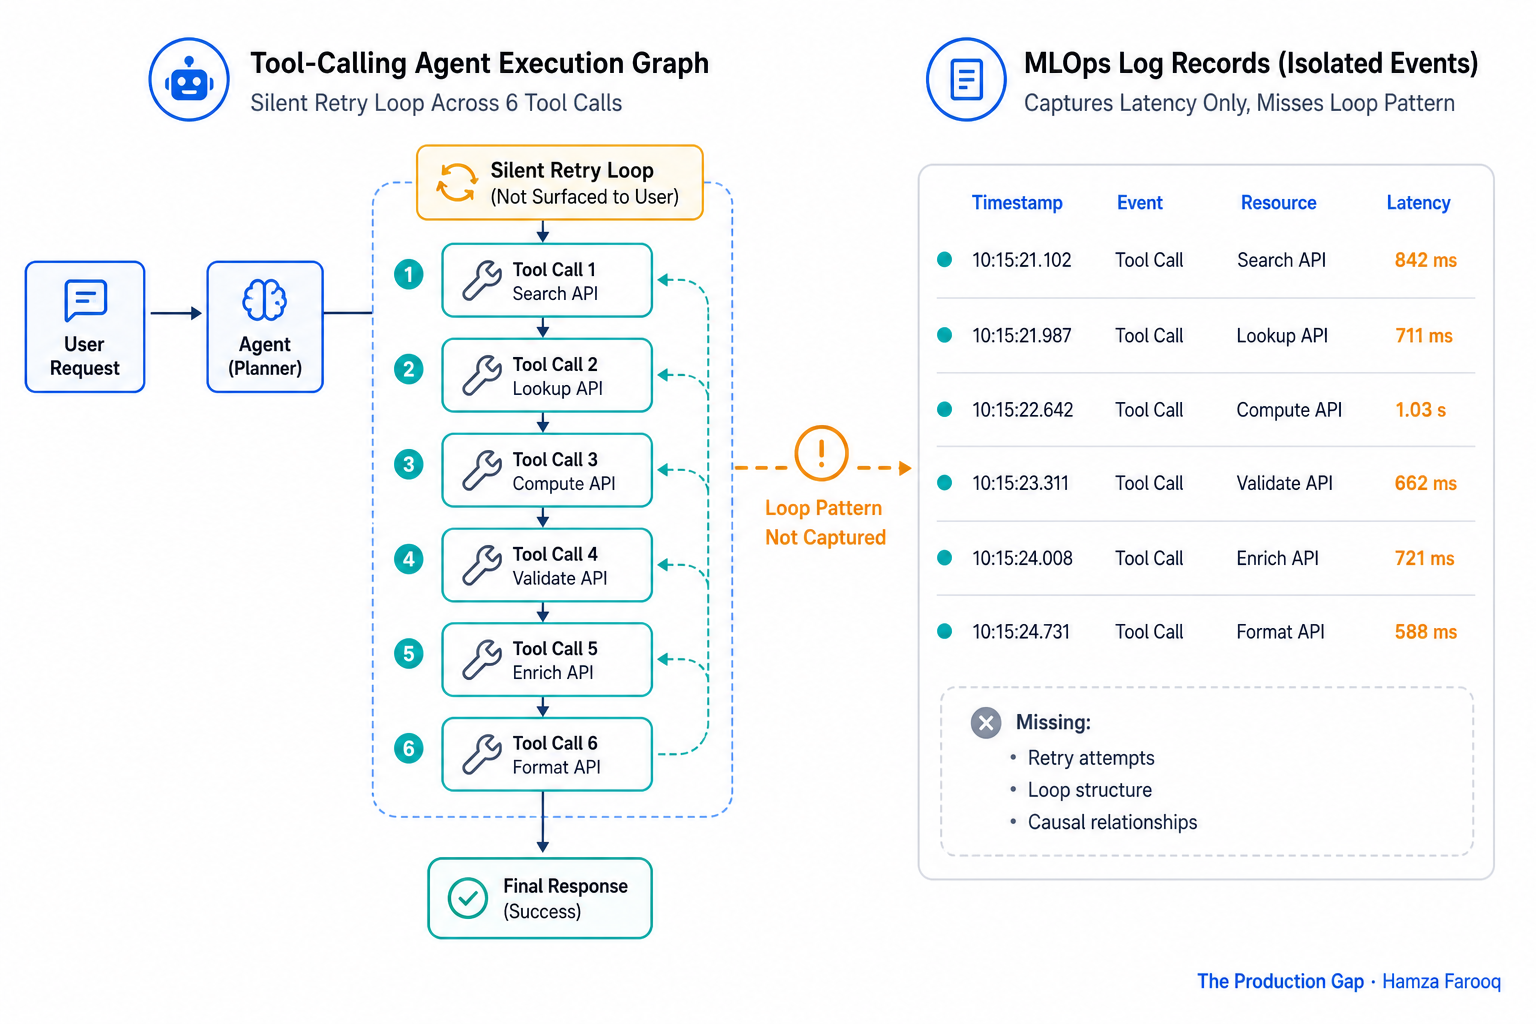
MLOps observability fails for tool-calling agents because it was designed to record one prediction per event, and agents do not work that way. A single agent task might involve an LLM call, a web search, a code execution call, a second LLM call to interpret the result, a conditional branch, and more tool calls before producing output. MLOps tooling records each LLM call as an isolated row. It cannot tell you the agent branched incorrectly at step 3 because a tool returned a malformed response at step 2.
What is a trajectory trace, and how does it differ from a standard application log?
A trajectory trace is a stateful, task-scoped record that reconstructs the complete sequence of an agent's decisions, tool invocations, inputs, outputs, and state changes from task start to completion. It is the core unit of agent observability that application logs cannot replicate.
Application logs are append-only event streams. They cannot answer: "Why did the agent call the database tool before the search tool, and what did it do with the result?" That question requires correlation across events that share a task context logs do not carry.
A trajectory trace bundles every step into a single navigable object: the initial task input, every LLM reasoning step, every tool call with its exact parameters and returned payload, every state mutation, every branching decision, and the final output or failure. As nhimg.org documents, agent observability must cover tool calls, state changes, reasoning traces, and error recovery, not just text output. An engineer opening one trajectory trace can see that a PDF parser returned an empty response at step 4, explaining why subsequent reasoning steps produced unreliable citations. Without the trace, that same engineer is left manually correlating logs.
Table 1: Observability scope by tool type
| Dimension | Application log | MLOps event record | Trajectory trace |
|---|---|---|---|
| Scope | Single event | Single prediction | Full task (N steps) |
| State | Stateless | Stateless | Stateful |
| Tool call visibility | None (unless manually logged) | None | Native, inputs and outputs per call |
| Decision path | Not captured | Not captured | Reconstructed end-to-end |
| Cost attribution | Per-request at best | Per-model-call | Per-task across all calls |
| Failure root cause | Must correlate manually | Not applicable | Visible as step-level diff |
| Branching and loops | Invisible | Invisible | Detected and annotated |
How do purpose-built agent observability tools handle cost attribution and non-linear execution?
Purpose-built agent observability tools attribute cost at the task level by instrumenting every LLM call and tool invocation within a single trace context, something general APM stacks and ML monitoring platforms do not do natively.
Purpose-built platforms make the trace, not the request, the primary billing and debugging unit. Oodle.ai delivers full-fidelity agent traces with sub-second search at $10 per million spans. As simpliaxis.com documents, observability platforms built for agents treat the AI trace as the primary object, capturing what happened across an agent's models, retrievers, and tools. If you cannot answer "which task type is costing the most and why," you have token counting, not agent monitoring.
Should you extend OpenTelemetry or use a purpose-built agent observability platform?
For most production agent deployments, purpose-built agent observability tools can deliver faster time-to-insight than extended OpenTelemetry, because they ship native trajectory tracing, tool-call schema, and task-level cost attribution without the custom instrumentation work OTel requires. The right choice depends on your team's existing infrastructure and capacity.
The following three scenarios, offered as a practical decision framework used in this guide, help frame the choice:
- Scenario A, OTel extension: Maximum flexibility inside existing infrastructure. The trade-off is meaningful: custom span design, manual task-context propagation through every tool call, and ongoing maintenance as agent frameworks evolve. It's achievable, but requires real engineering investment before yielding meaningful LLM agent tracing.
- Scenario B, Purpose-built platform: Native trajectory tracing, out-of-the-box tool-call visibility, automated cost attribution. The trade-off is vendor dependency and per-span pricing at volume. Right for teams that need production visibility quickly.
- Scenario C, Hybrid: OTel for infrastructure signals, a purpose-built platform for trajectory and cost data. As Swept.ai notes, full-stack AI observability now spans engineering, data, and compliance teams, which pushes many enterprises toward layered stacks rather than a single tool.
Frequently Asked Questions
Can OpenTelemetry be used for agent observability, or does it need agent-specific extensions? OTel can instrument agent runs but requires custom span schemas and manual task-context propagation to capture tool-call sequences and cost-per-task. Without those extensions, it records isolated events rather than trajectories.
What is the minimum data a trajectory trace must capture to be useful for AI agent debugging? Every LLM call with inputs and outputs, every tool invocation with exact parameters and returned payload, state changes between steps, branching points, and the final task outcome. Missing tool call payloads alone turns root-cause analysis into guesswork.
How do agent observability tools handle branching or looping execution graphs? Purpose-built platforms represent execution as a graph object. Loops are detected by comparing repeated node signatures within a single trace, and branches are annotated as conditional paths that are invisible to flat log streams.
Why is cost-per-task attribution harder for agents than for standard LLM API calls? Standard LLM calls have fixed per-request costs. Agent tasks spawn unpredictable numbers of LLM and tool calls at runtime. Only a task-scoped trace that sums all spend across the full execution graph gives an accurate per-task figure.
Conclusion
Teams often discover this problem when they cannot explain why agent costs have increased or why a task type is failing while the dashboard shows healthy uptime. That gap is not a monitoring configuration problem. It is a design mismatch between tools built for stateless prediction events and agents that are stateful, multi-step, and variable-cost.
MLOps tools record events. Agent observability tools record trajectories. That difference determines whether you can debug a failure at step 4 of 12, attribute unexpected spend to a retry loop, or catch a branching error before it affects downstream outputs.
The agent is not a model. Start with a single task type, instrument it with a trajectory-aware tool, and compare what you see against your existing monitoring view.
Learn from me
Agent Engineering Bootcamp: Developers Edition, my Maven cohort. Advanced agentic RAG, multi-agent orchestration, memory, evals, and guardrails. Take agents from prototype to production. Join the next cohort →
Hire us
Traversaal.ai. We're a team of forward deployed engineers solving the toughest AI problems for Fortune 100 companies: document intelligence, agentic data platforms, and real-time web intelligence, deployed in production. Work with our team to deploy your next agentic ecosystem. Talk to Traversaal.ai →
Join us
Want to solve these problems with us? We're always looking for forward deployed engineers who want to ship production AI. jobs@traversaal.ai
