
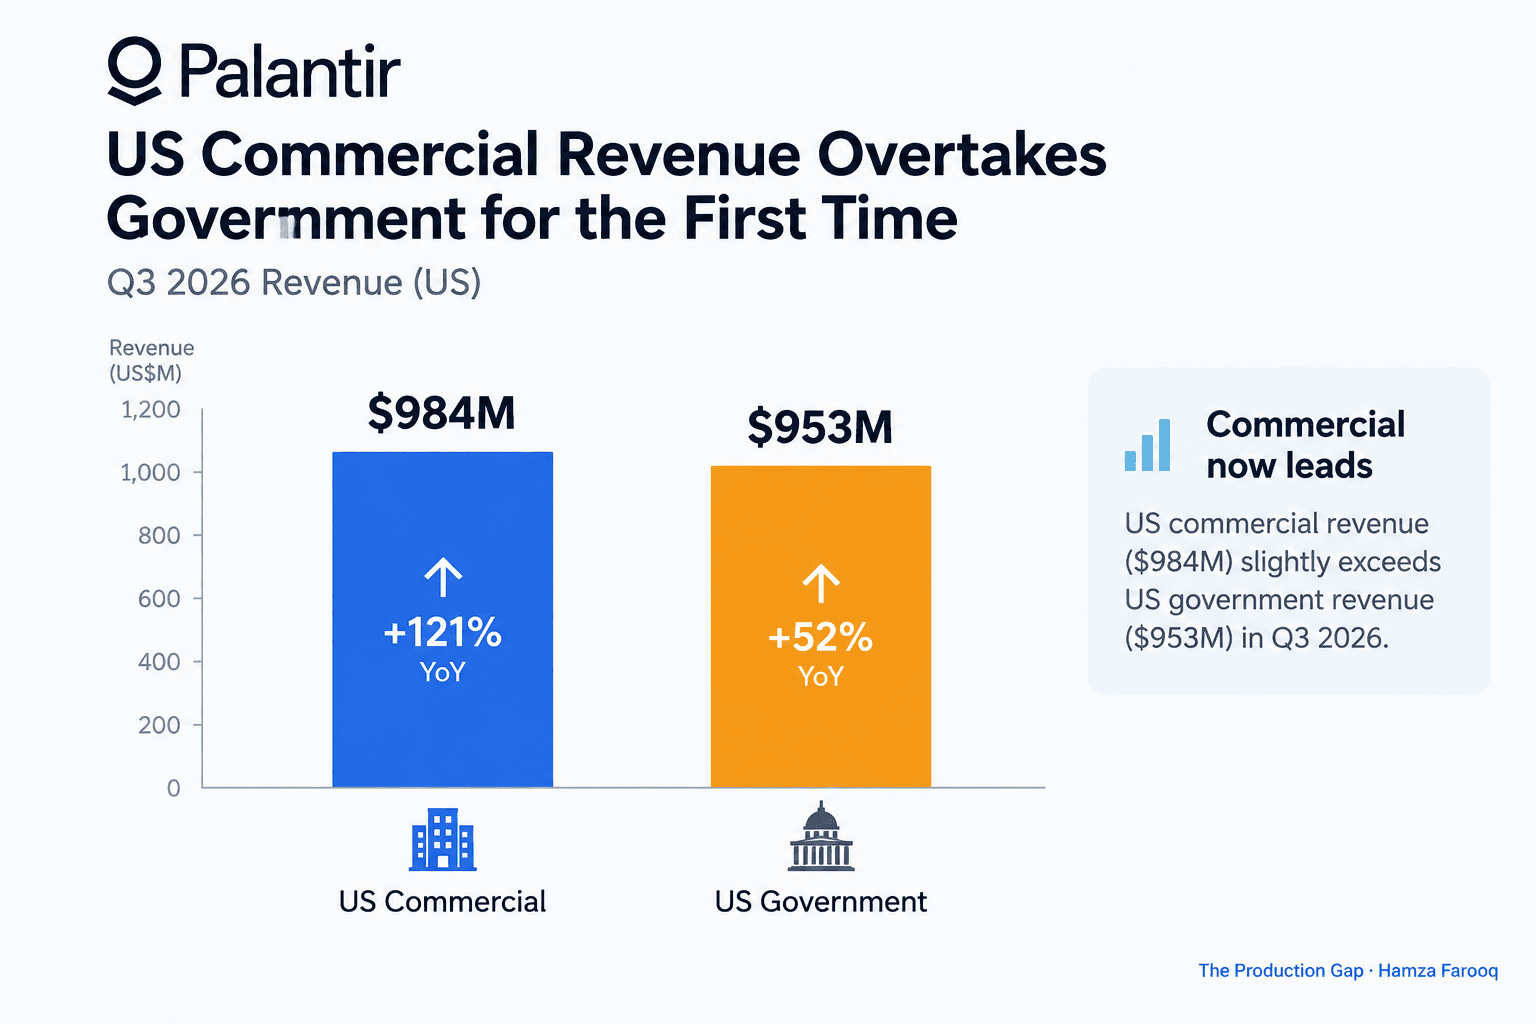
Palantir's US commercial revenue rose 148% year over year to $984 million in Q3 2026, surpassing US government revenue of $953 million for the first time. Total revenue rose 96% to $2.31 billion.
TL;DR: In Q3 2026, Palantir US commercial revenue reached $984 million, up 148% year over year, surpassing US government revenue of $953 million for the first time. This milestone reflects compounding forward-deployed engineer expansion within existing accounts rather than new contract wins alone. When customers deepen platform usage organically, revenue concentration shifts without proportional sales cost, confirming the land-and-expand model is maturing at scale.
Key Takeaways
- US commercial just passed government in Q3 2026: $984 million versus $953 million, a first in Palantir's history.
- Land-and-expand is the core model: Q3 2026 revenue reflects forward-deployed engineer investment made in earlier quarters, not Q3 selling activity alone.
- AIP's precise contribution cannot be separated from baseline FDE momentum using public Q3 2026 disclosures.
- Q3 2026 figures are management-reported, not yet audited: independent audit follows the 10-Q filing.
- Sustained commercial leadership would reduce Palantir's dependence on defense budget and appropriations cycles.
Why does Palantir US commercial revenue surpassing government in Q3 2026 matter structurally?
In Q3 2026, Palantir US commercial revenue surpassing government for the first time is a structural signal worth examining carefully, because it suggests the enterprise model may now compound independently of defense budget cycles. That would be a genuine change to the company's risk profile, but one quarter is not confirmation of a durable new state.
The headline numbers are straightforward: $984 million in US commercial revenue, up 148% year over year as of Q3 2026 earnings, edged past $953 million in US government revenue. Total revenue reached $2.31 billion, up 96%.
What those numbers measure, and what they omit, is the harder question. The revenue figure tells you something true about the past; the cost structure behind it tells you something more important about what comes next.
What does Palantir's US commercial revenue actually measure in Q3 2026, and what gets left out?
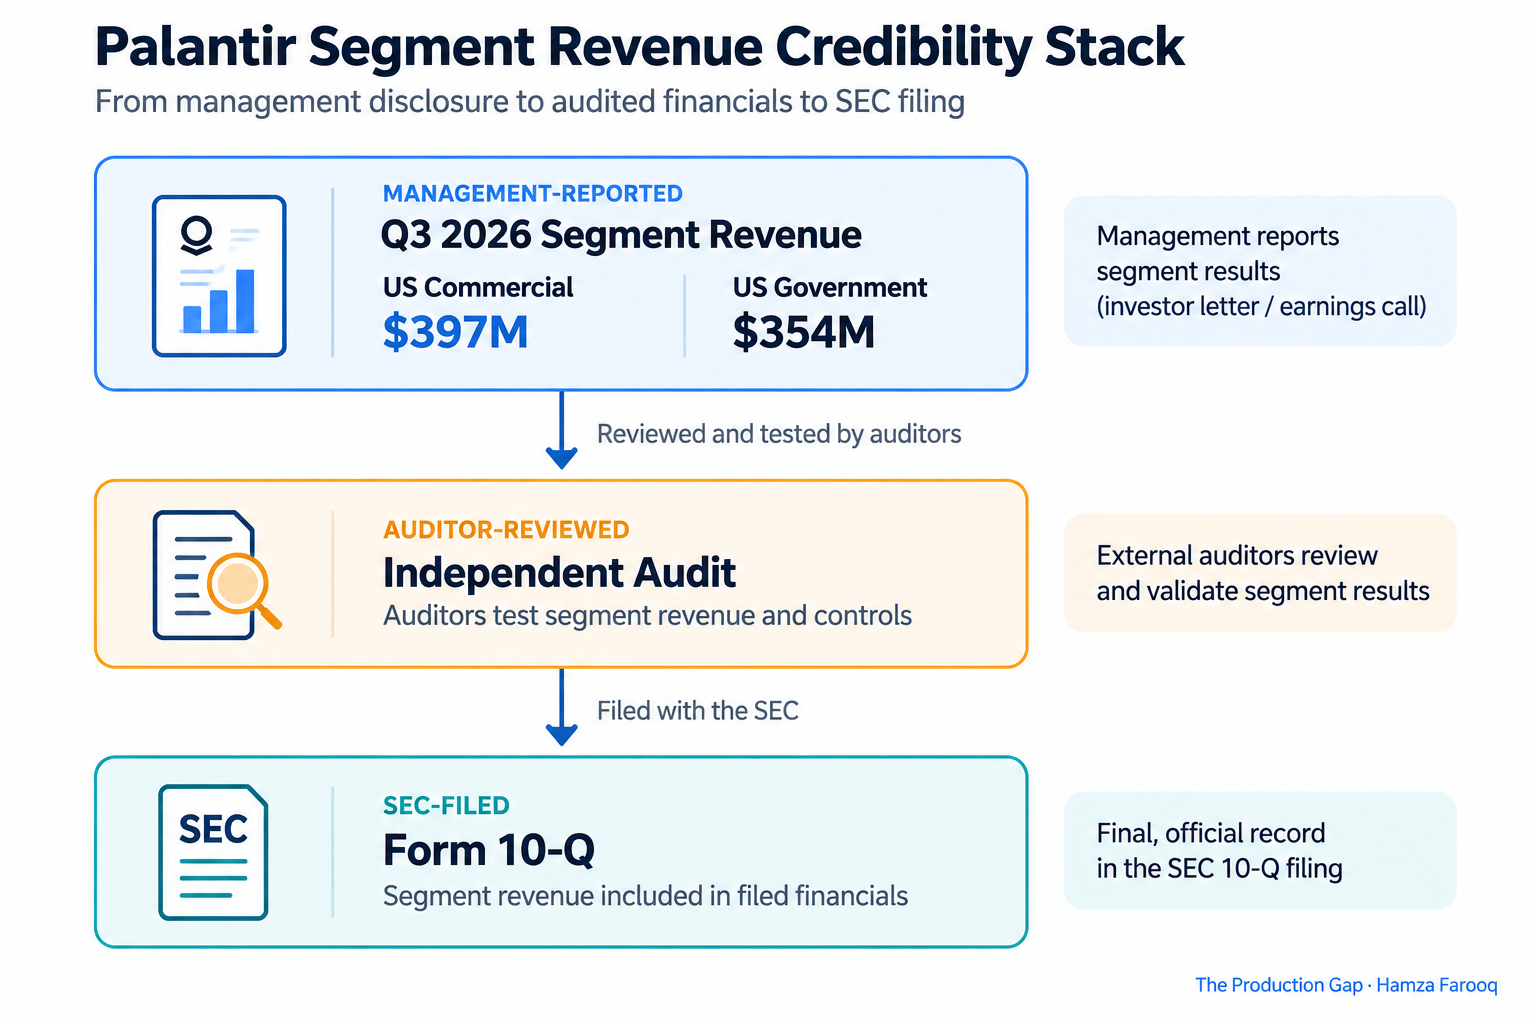
Palantir's US commercial revenue captures recognized revenue from US enterprise contracts in Q3 2026, but it is a management-reported segment number, not independently audited at earnings release, and should be treated as a directional signal rather than a settled accounting fact.
Three numbers matter and routinely get conflated: total contract value, remaining performance obligations, and recognized revenue in the period. Palantir's segment line reports only the last of these. The $984 million Q3 2026 figure sits at the first tier of what this guide calls the Segment Revenue Credibility Stack: management-reported, then auditor-reviewed, then SEC-filed 10-Q. Each tier is more reliable than the one above it.
How do Q3 2026 US commercial and government revenue compare across key dimensions?
US commercial and US government revenue differ not only in size in Q3 2026 but in expansion speed, budget dependency, and replicability of use cases, differences that matter more than the dollar gap for forecasting.
Defense contracts are large but slow to expand. Procurement timelines stretch long, budget cycles are annual, and classified work limits replicability across accounts. Commercial accounts can add use cases inside a single fiscal quarter. If the commercial segment sustains a growth rate above the government line, Palantir's revenue mix becomes less correlated with the appropriations cycle.
| Dimension | US Government Revenue (Q3 2026) | US Commercial Revenue (Q3 2026) |
|---|---|---|
| Reported quarter figure | ~$953 million | ~$984 million |
| YoY growth rate | Not separately disclosed in Q3 2026 earnings release | 148% |
| Contract expansion speed | Quarters to years | Weeks to months |
| Budget dependency | Congressional appropriations | Enterprise capex and opex |
| Replicability of use cases | Constrained by classification | High across industry patterns |
| Primary growth lever | Renewal and scope expansion | FDE-driven land-and-expand |
This is a first crossing in Q3 2026, not a proven new state. The next two quarters will show whether it holds.
How does the forward-deployed engineer model convert to Q3 2026 revenue, and where is the lag?
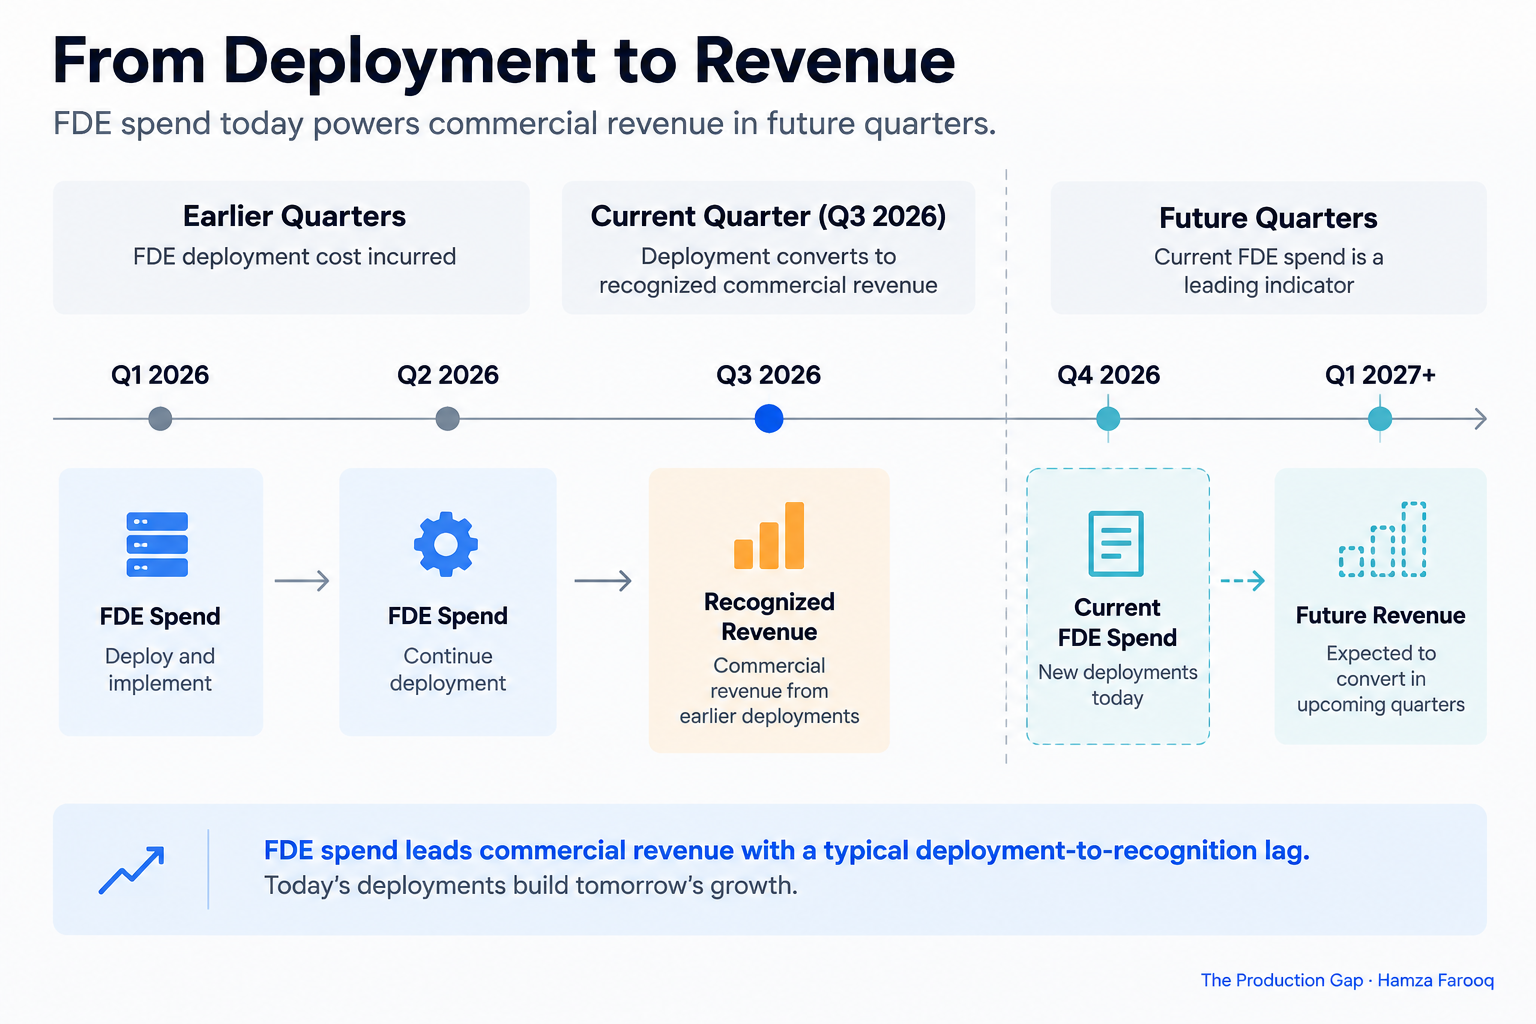
Palantir's forward-deployed engineers generate revenue not in the quarter they deploy but in later quarters, a timing gap that distorts period-to-period readings of figures like the Q3 2026 commercial result.
Using the framework applied throughout this guide: as of Q3 2026 earnings, reported revenue reflects FDE investment from earlier periods, and the FDE spend hitting Palantir's cost structure in Q3 2026 is the investment behind future revenue. The more practical framing for analysts is that past investment is converting into the current quarter's headline numbers, and current FDE spend is the leading indicator of whether this rate holds beyond Q3 2026.
How much of the Q3 2026 acceleration is AIP, and how much is land-and-expand doing what it always does?
Separating AIP's contribution from the underlying model's maturation is not possible from Q3 2026 public disclosures, but full-year US commercial growth of 109% suggests AIP compressed the expansion cycle rather than created it.
Three things cannot be disentangled from Q3 2026 public data: FDE-driven expansion that would have occurred without AIP; AIP-specific new contract wins; and existing customers adding AIP as a new workload on existing contracts. The FDE model is the foundation. AIP may be accelerating the pilot-to-production motion rather than replacing it.
Enterprise buyers evaluating Palantir's go-to-market need to know whether the Q3 2026 growth rate reflects the model's maturation or a specific product cycle. That distinction governs the durability of every forecast built on Q3 2026 results.
Frequently Asked Questions
What is Palantir's land-and-expand model?
Palantir enters enterprise accounts on small pilots, then grows revenue as clients add use cases over time. Low initial contract value minimizes procurement friction, and the embedded-engineer relationship creates switching costs and expansion opportunities across subsequent quarters, including those following Q3 2026.
How should analysts adjust models for the FDE cost-revenue lag?
Analysts should track sales and marketing expense and FDE headcount as leading indicators because these costs precede recognized revenue by one or more quarters. In the author's reading of this framework, the Q3 2026 commercial result reflects FDE investment made before Q3 2026, so current FDE spend on the income statement is the more forward-looking variable to monitor. Because the precise lag interval is not separately disclosed in public filings, any specific estimate should be treated as author inference rather than reported fact.
Are Palantir's Q3 2026 segment revenue figures audited?
No, not at the Q3 2026 earnings release. Segment figures are management-reported. Independent audit is completed when the 10-Q is filed with the SEC, typically weeks after earnings, and that filing is the document against which the reported $984 million and $953 million should be validated.
Does Q3 2026 commercial revenue surpassing government change Palantir's investor risk profile?
Yes, directionally. Sustained commercial leadership would make revenue less correlated with defense appropriations and more correlated with enterprise capex trends. Those are different cyclical risks with higher expansion optionality, but one quarter of data, Q3 2026, is not sufficient to confirm the shift is durable.
Conclusion
The Q3 2026 US commercial figure, $984 million, up 148% year over year and ahead of government revenue for the first time, is easy to cite and harder to interpret correctly. Three things belong in every model built on it: the figures are management-reported and not yet audited at the time of the Q3 2026 earnings release; the revenue reflects FDE investment from prior quarters, not Q3 selling activity alone; and AIP's precise contribution cannot be isolated from public Q3 2026 data.
What the Q3 2026 number does confirm, as a practical rule of thumb drawn from the framework in this guide, is that Palantir's land-and-expand model has reached a scale where the commercial segment can plausibly compound on its own trajectory. Whether that holds in coming quarters depends less on near-term AIP closes than on the FDE deployments Palantir is funding right now, costs already on the Q3 2026 income statement, invisible in the revenue line.
When the 10-Q is filed, compare audited segment figures against the reported $984 million and $953 million, then cross-reference FDE-related headcount and sales and marketing expense against the revenue trajectory. That filing is the document to validate or revise every model built on today's Q3 2026 numbers.
Learn from me

Forward Deployed Engineering Bootcamp for Full-Stack Developers, my Maven cohort. Build and ship complete AI products end to end, from React and Node.js frontends to deployed models with caching and observability. Join the next cohort →
Hire us
Traversaal.ai. We're a team of forward deployed engineers solving the toughest AI problems for Fortune 100 companies: document intelligence, agentic data platforms, and real-time web intelligence, deployed in production. Work with our team to deploy your next agentic ecosystem. Talk to Traversaal.ai →
Join us
Want to solve these problems with us? We're always looking for forward deployed engineers who want to ship production AI. jobs@traversaal.ai
